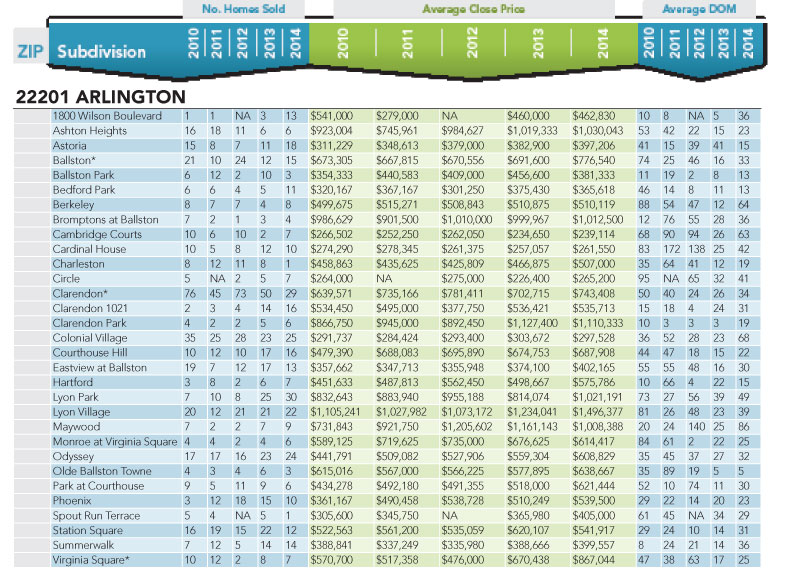
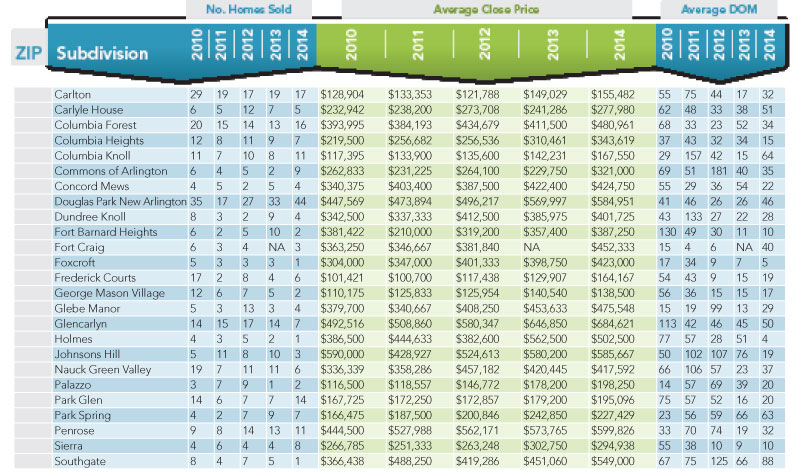
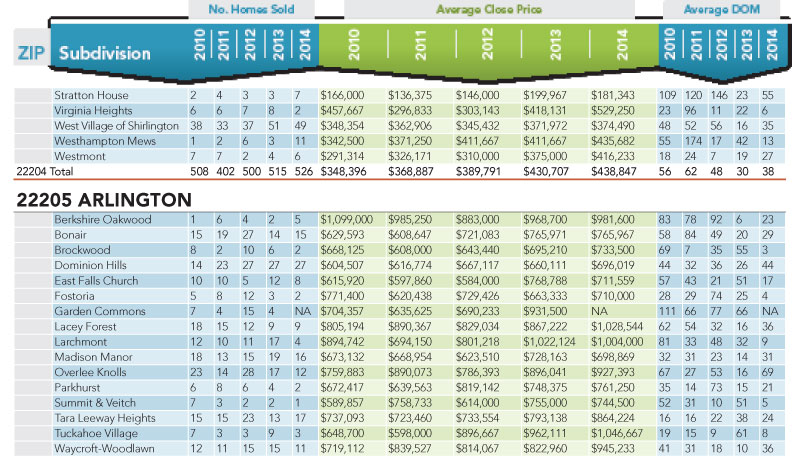
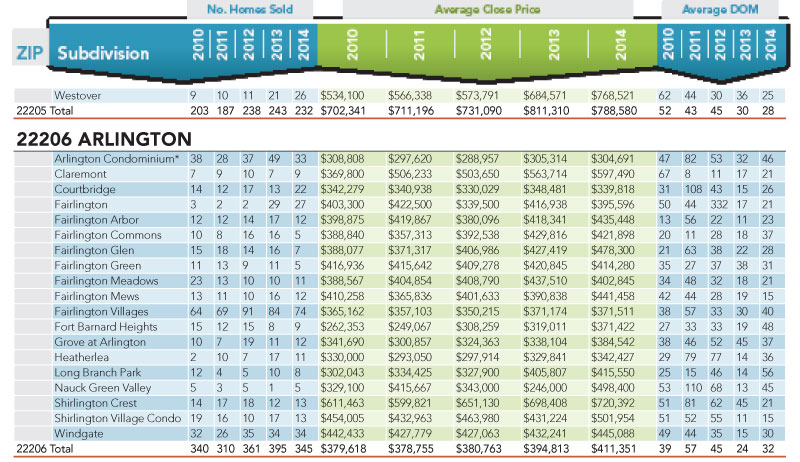
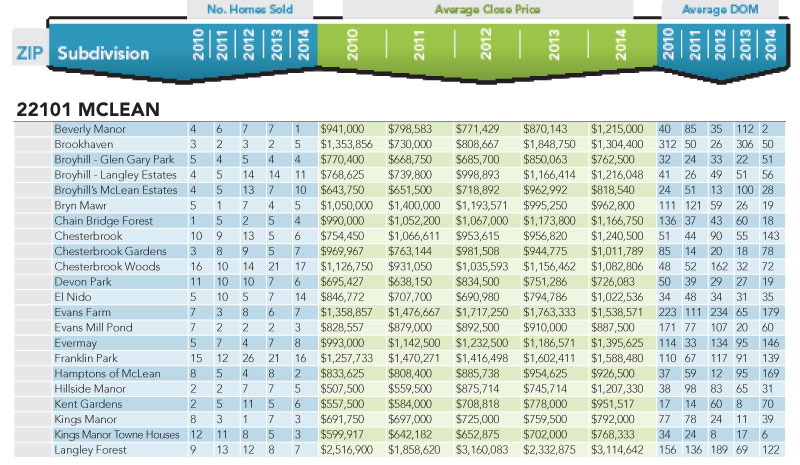
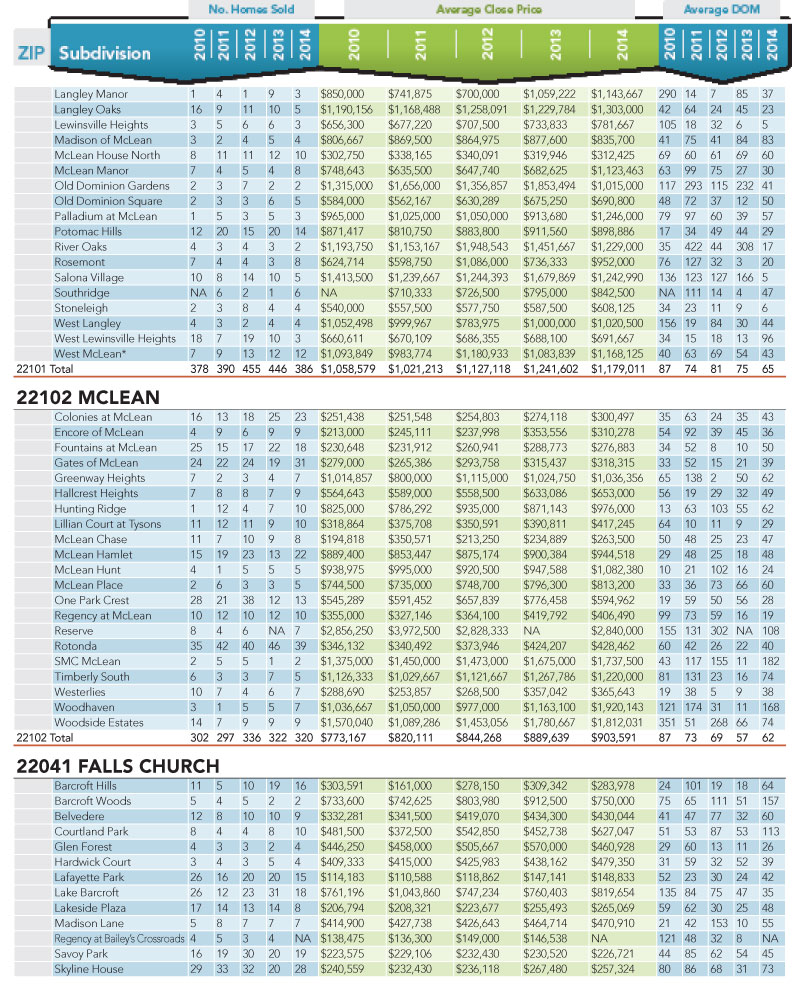
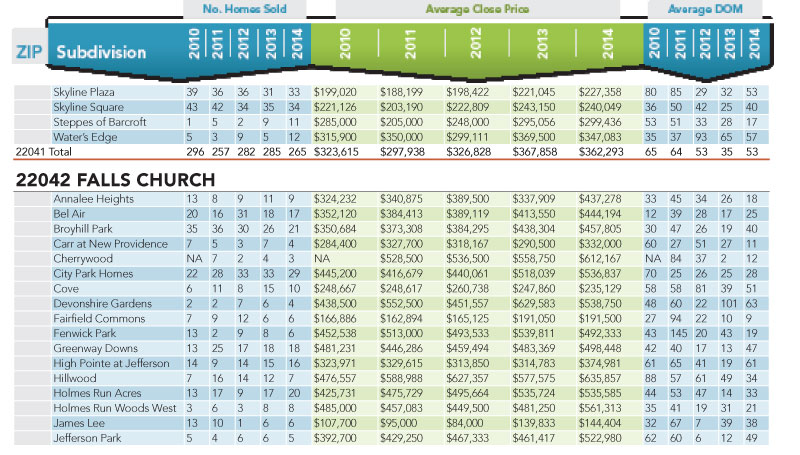
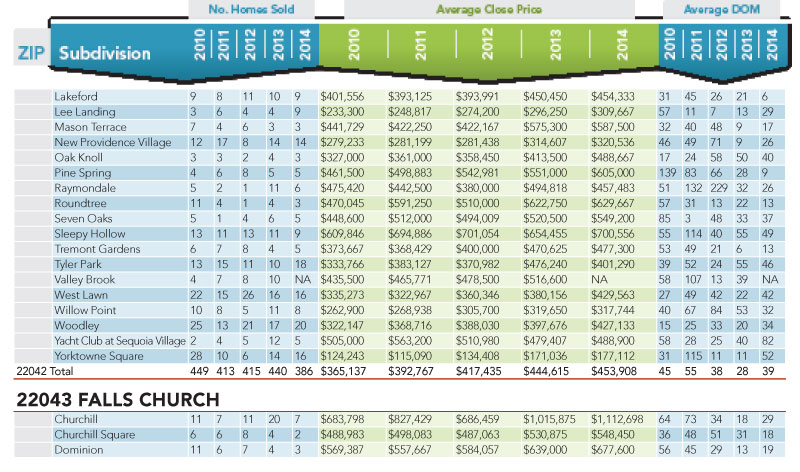
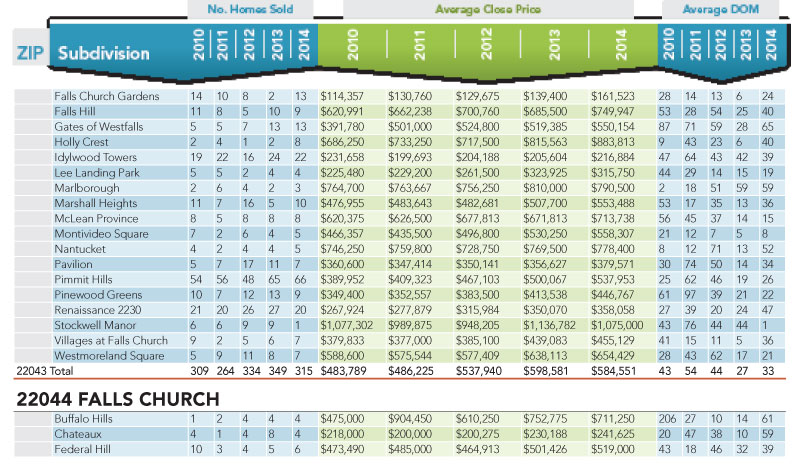
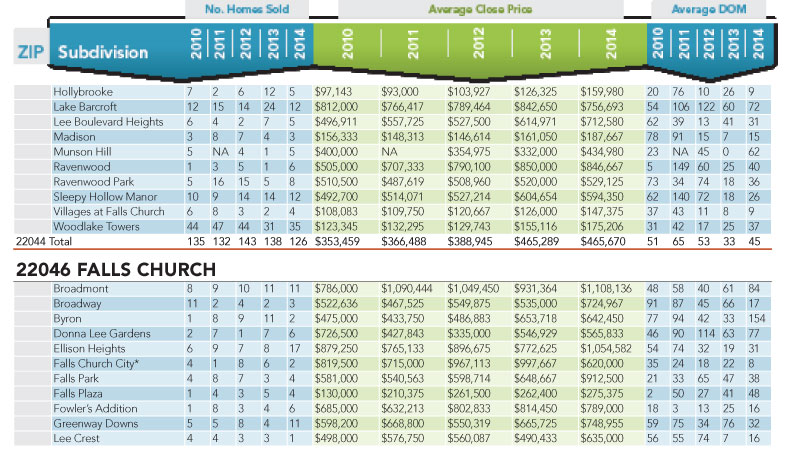
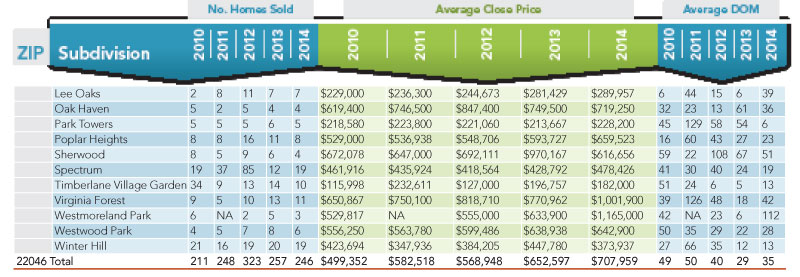
Where are homes selling the fastest? Which neighborhoods are commanding the highest price tags? Find out in the following tables, which track residential sales for single-family homes, condos and townhouses in our area. You’ll find figures indicating the number of homes sold, average close prices and average number of days on the market (DOM) in more than 300 neighborhoods in Arlington, Falls Church and McLean from 2010 to 2014. Condo buildings are typically listed as individual subdivisions. The neighborhoods included had at least 15 total sales during the last five years. The totals for each ZIP code reflect all sales in that ZIP code, not just the totals for the selected neighborhoods. Because subdivisions entered into MRIS are not required to follow a standard nomenclature, we have expanded this year’s data sets to account for misspellings and inconsistencies in many subdivision names. Real estate agents may also enter sales into the MRIS database retroactively. As a result, some of the historical data may vary from the data in previous years’ charts.